Note
Click here to download the full example code
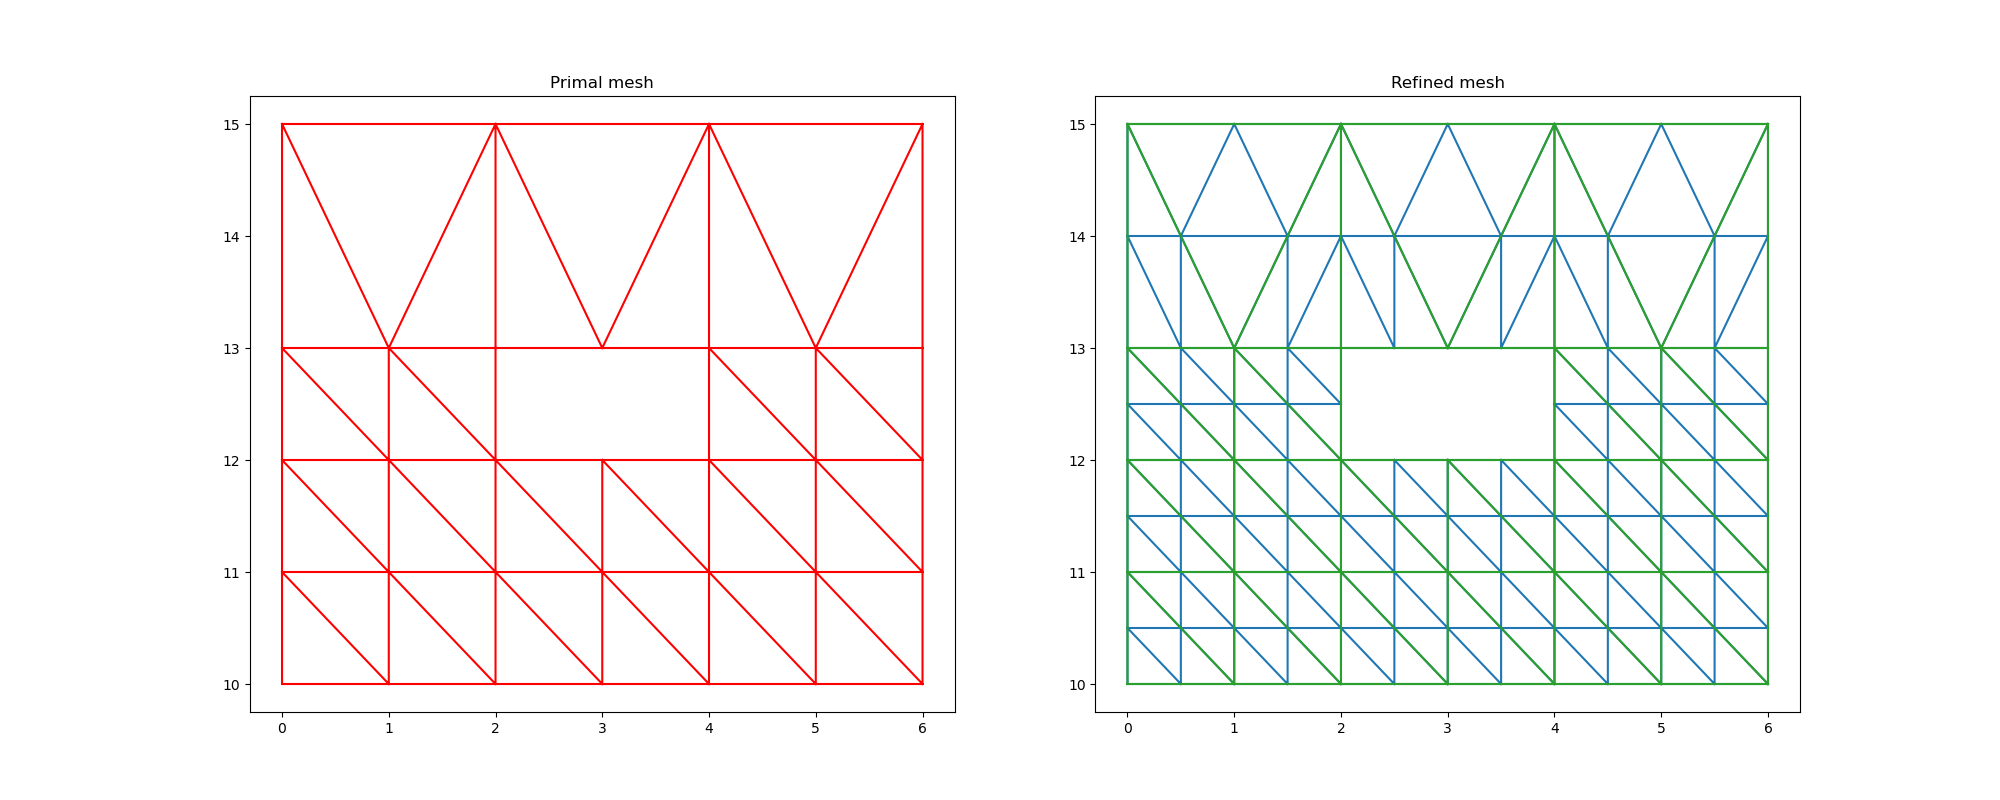
Refine a TriangularMesh by splitting
A “refined” TriangularMesh is built based on a primal mesh. All triangles are subdivided into 4 new triangles. Primal node numerotation is kept during the process.
import freshkiss3d as fk
import freshkiss3d.extra.plots as fk_plt

import matplotlib.pyplot as plt
import numpy as np

def fancy_plot(x,y,trivtx,vertex_labels,boundary_edges):
    colors = {0:'blue', 1:'red', 2:'green'}
    plt.figure(figsize=(8,8))
    # Plot triangles.
    plt.triplot(x, y, trivtx)
    xtri = np.average(x[trivtx], axis=1)
    ytri = np.average(y[trivtx], axis=1)
    fk_plt.put_text_index(xtri,ytri,color='red')
    # Plot points.
    for a, b, label in zip(x, y, vertex_labels):
        plt.plot(a, b, marker='o', color=colors[label], markersize=10)
    fk_plt.put_text_index(x,y,offset=(0.04,0.04))
    # Plot edges.
    for B in range(boundary_edges.size):
        i0 = boundary_edges.vertices[B,0]
        i1 = boundary_edges.vertices[B,1]
        x0,y0 = x[i0], y[i0]
        x1,y1 = x[i1], y[i1]
        plt.plot([x0,x1], [y0,y1], color=colors[boundary_edges.label[B]], linewidth=3.)
    plt.grid()
    plt.axis('scaled')
    plt.xlim(-0.5,6.5)
    plt.ylim(9.5,15.5)
    plt.show()
Construct primal mesh
triangular_mesh = fk.TriangularMesh.from_msh_file('inputs/tiny.msh')

TG = triangular_mesh.triangulation
x = np.asarray(TG.x)
y = np.asarray(TG.y)
trivtx = np.asarray(TG.trivtx)

fancy_plot(x, y, trivtx,
           triangular_mesh.vertex_labels,
           triangular_mesh.boundary_edges)

Refine mesh
To refine mesh by splitting, simply call triangular_mesh.refine_by_splitting() method, it returns the refined mesh.
triangular_mesh_refined = triangular_mesh.refine_by_splitting()

TG_r = triangular_mesh_refined.triangulation
x_r = np.asarray(TG_r.x)
y_r = np.asarray(TG_r.y)
trivtx_r = np.asarray(TG_r.trivtx)

fancy_plot(x_r,y_r,trivtx_r,
           triangular_mesh_refined.vertex_labels,
           triangular_mesh_refined.boundary_edges)
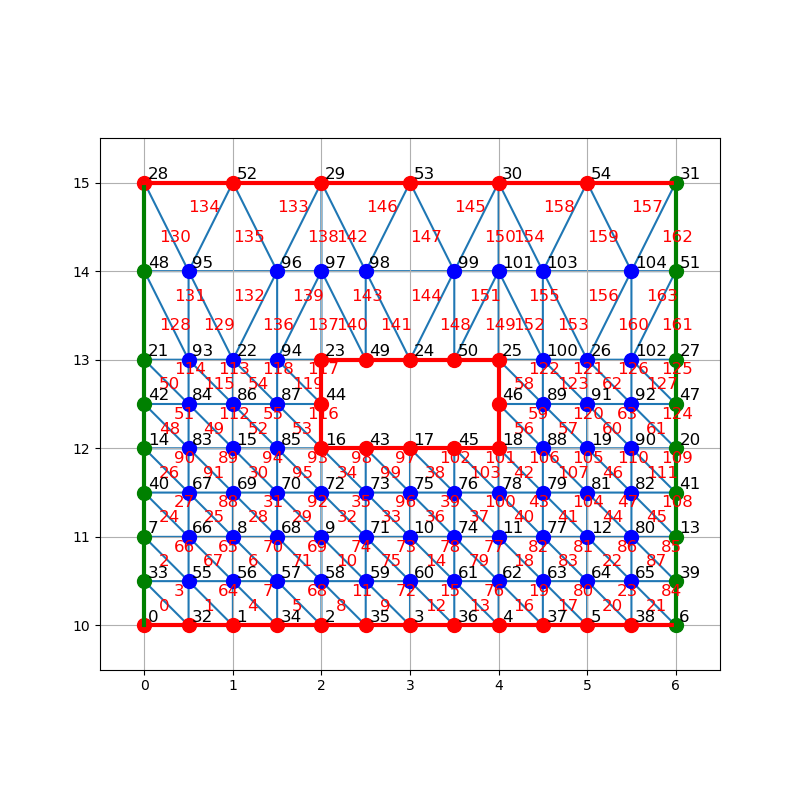
Note
Refined mesh is defined so that node index of primal mesh is conserved. Moreover subtriangles numerotation follow the same pattern, cycling counterclock wise and starting from bottom left corner with last subtriangle being at center of the primal triangle.
Mesh comparison
plt.rcParams["figure.figsize"]=[20,8]
fig = plt.figure()

# Plot
ax1 = fig.add_subplot(121)
ax1.triplot(x, y, trivtx, color='r')
ax1.set_title("Primal mesh")

# Plot refined mesh
ax2 = fig.add_subplot(122)
ax2.triplot(x_r, y_r, trivtx_r)
ax2.triplot(x, y, trivtx)
ax2.set_title("Refined mesh")

plt.show()
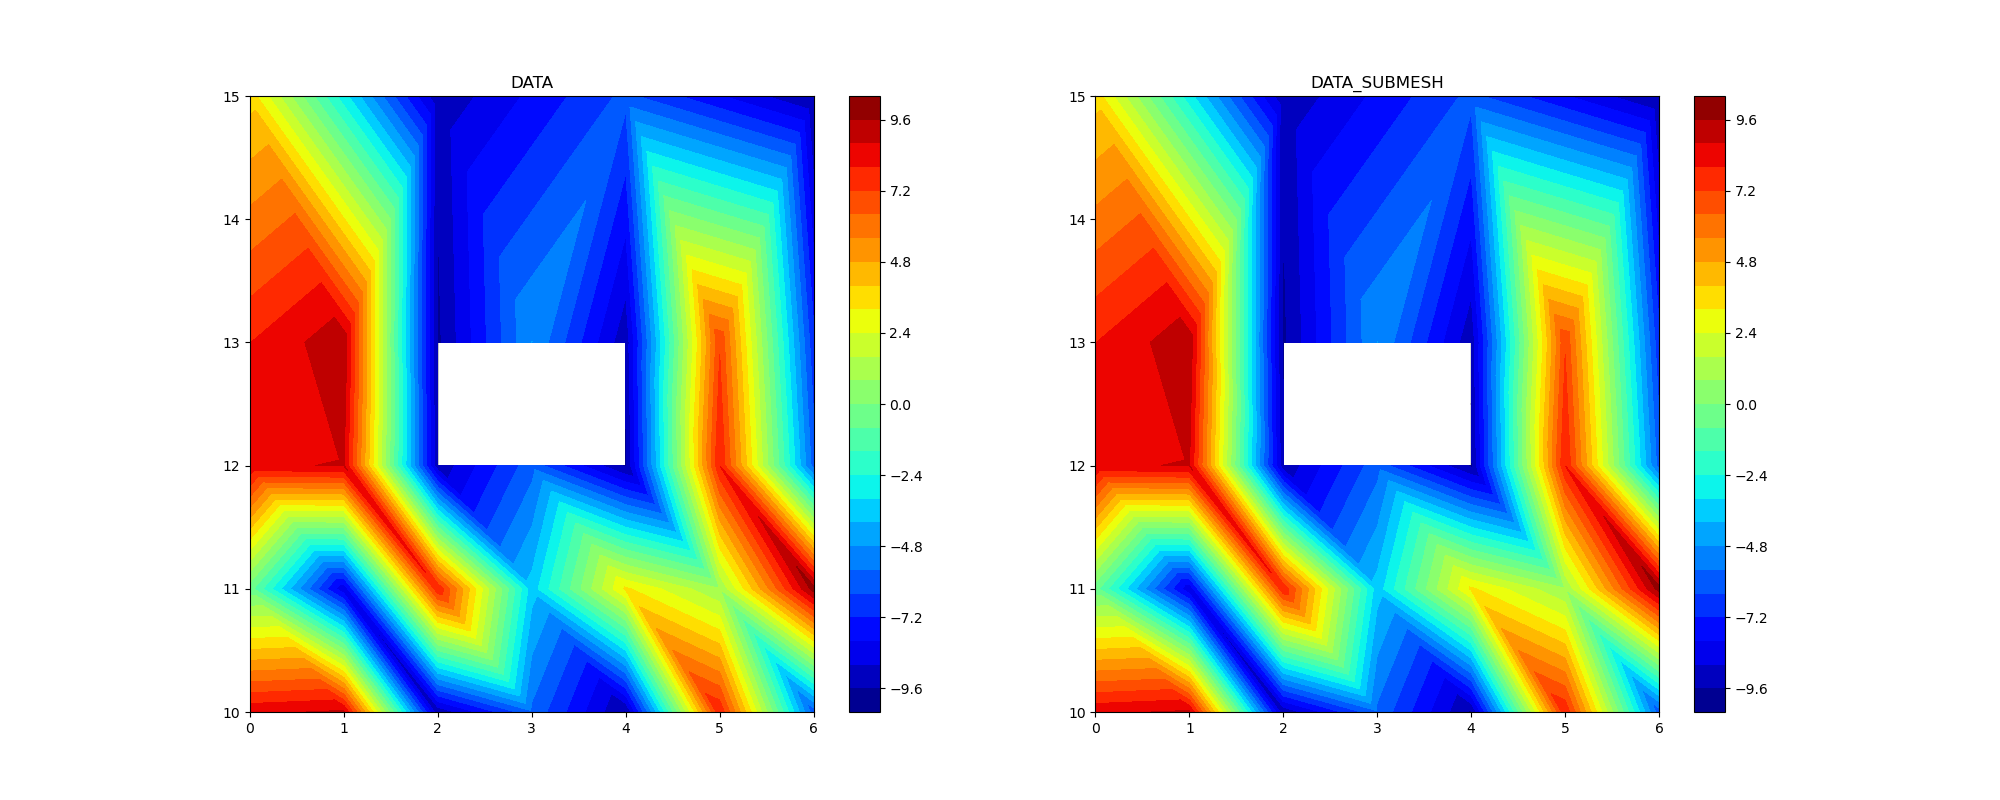
Interpolation on submesh
When refinement is carried out, data interpolation on submesh may be necessary
(cf. topography). Let’s define a random DATA vector of length triangular_mesh.NV
for which values are set on primal triangular_mesh.
Interpolation of DATA on submesh or any nodes is possile via the fk.XYLinearInterpolator
class. First the class needs to be initialized with triangular_mesh and
traget_nodes (or traget_mesh):
Note
traget_nodes is an array of size [NC,2] containing x, y coordonates of
points on which to interpolate. traget_mesh is a fk.TriangularMesh class.
interpolator = fk.XYLinearInterpolator(triangular_mesh,
                                       target_mesh = triangular_mesh_refined)
Then the method interp() can be called to interpolate DATA. The
DATA_SUB output is an array of size target_mesh.NV or target_nodes.size().
DATA_SUB = interpolator.interp(DATA)
Note
When initialized XYLinearInterpolator precomputes all interpolation factors
on triangles containing targeted nodes so that interp() method can be called
multiple times to interpolate various data.
#Plots:
plt.rcParams["figure.figsize"]=[20,8]
fig = plt.figure()

# Subplot 1: DATA
ax1 = fig.add_subplot(121)
ax1.triplot(x, y, trivtx, color='k', lw=0.5)
im1 = ax1.tricontourf(x, y, trivtx, DATA[:], 30, cmap=plt.cm.jet)
fig.colorbar(im1, ax=ax1)
ax1.set_title("DATA")

# Subplot 2: DATA_SUB
ax2 = fig.add_subplot(122)
ax2.triplot(x_r, y_r, trivtx_r, color='k', lw=0.5)
im2 = ax2.tricontourf(x_r, y_r, trivtx_r, DATA_SUB[:], 30, cmap=plt.cm.jet)
fig.colorbar(im2, ax=ax2)
ax2.set_title("DATA_SUBMESH")

plt.show()
Total running time of the script: ( 0 minutes 1.272 seconds)